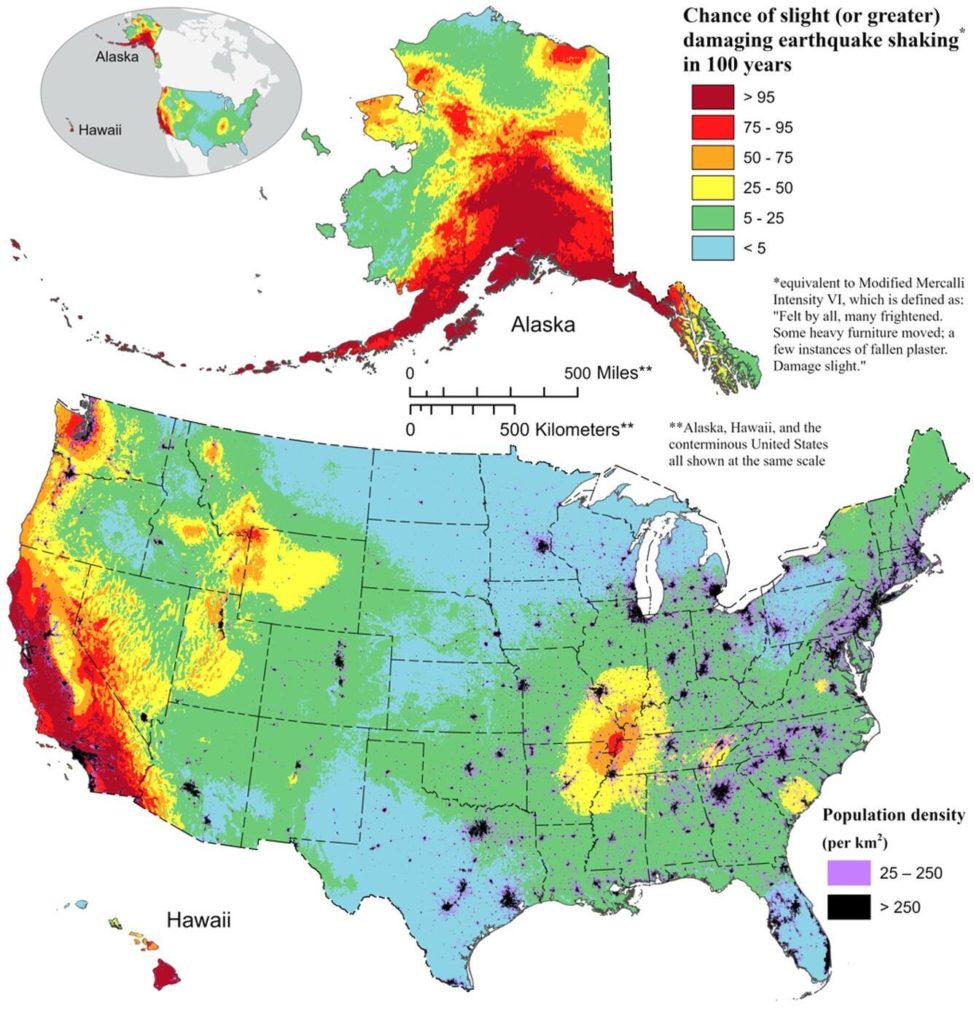
The United States Geological Survey (USGS), is a government agency whose job is to “monitor, assess, map, and conduct targeted scientific research so that policymakers and the public have the understanding they need to address complex environmental, natural resource, and public safety issues.” One area that the USGS researches is seismology, or the study of earthquakes and related events. Their scientists have created a map that shows the areas of the United States where dangerous earthquakes are likely to occur. Maps like this have been made in the past, but the last one was created in 2018 and only covered the continental U.S. The maps of Alaska and Hawaii were last updated in 2007 and 1998, respectively.
These maps were congressionally requested due to their ability to help regions that are most likely to be affected to prepare for these events by predicting the scales of the earthquakes. The maps were made through “insights from seismic studies, historical geologic data, and the latest data-collection technologies.” This technology has also found around 500 faults which are areas between two rocks in the Earth’s crust that are where most earthquakes occur as they are caused by the movement of tectonic plates. The new map shows that the likelihood of more damaging earthquakes throughout the northeastern United States has increased, and the severity of earthquakes in Alaska and California has also increased. Recent volcanic eruptions from Hawaii’s second largest volcano, Kīlauea, have influenced a greater likelihood of dangerous earthquakes on the islands as well. Overall, 75% of the United States could experience these possibly dangerous earthquakes within the next 100 years.
This model not only warns citizens about future earthquakes, it helps city planners and officials plan for the damage by building earthquake-friendly structures and updating older buildings to become more safe. Although the map cannot be 100% accurate or predict the times at which these events are likely to occur, it should be a helpful tool for susceptible areas to prepare for the worst.
